tools »
『Moonshot is all you need』 01 - 5分钟上手极简量化回测框架
做基本面策略回测,不想用 backtrader 这样的框架,但 Alphalens 也不适合日线;另外,作为初学者,希望能从零开始实现一个策略回测,有助于了解策略回测的原理。这个想法也没错,关键是,要如何实现?
这一系列文章,将以中金2023年的一期研报为例,介绍如何实现一个较复杂的策略回测。我们将学习到如何获取各种数据,如何进行数据预处理,如何设计回测框架等关键技术。
 图1 中金研报
这个策略从股息收益、资本利得和风险规避三大维度入手,综合了事件选股和因子选股的手段,最终回测结果表明,近5年年化收益率达到29%。
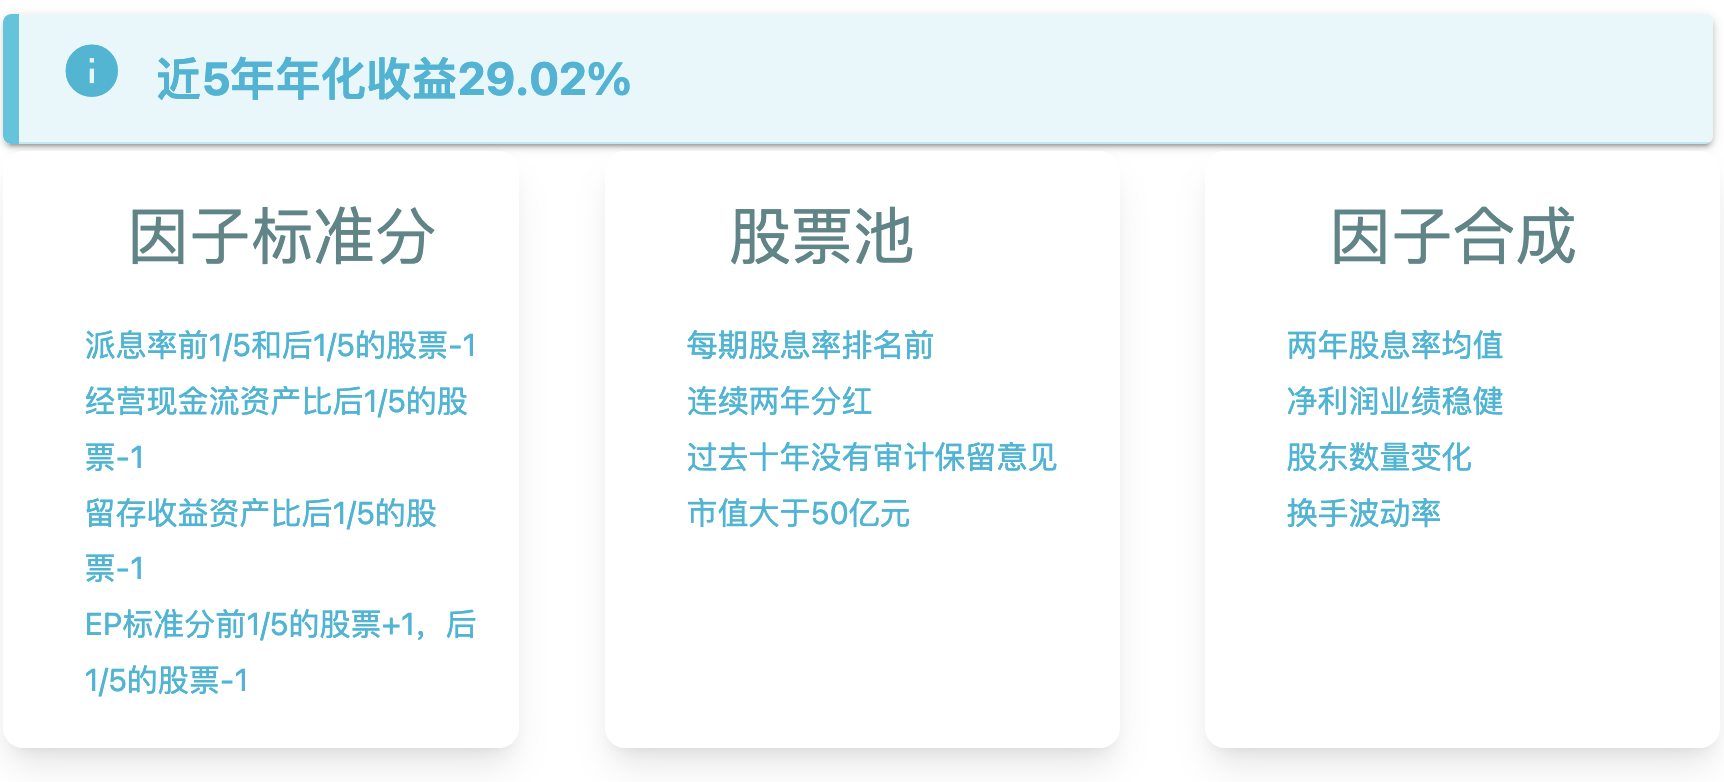 图2 基本面策略构建思路
我们将实现一个可用于月度调仓策略的普适性框架,它有这些特点:
- 按月调仓 适用于基本面策略
- 模块职责划分清晰 易于叠加组合
- 简单易上手
核心驱动框架
往简单里说,回测就是在指定的时间段(过去)里:
- 根据当时能得到的数据,发出交易信号
- 根据交易信号进行调仓
- 计算策略的每个交易期的收益
- 策略评估与可视化
一般来说,第一步是策略的核心。策略不同,要使用的数据也不同,构建的因子,以及决策逻辑也不同。但其它部分可以做到重复使用。特别是第4步,策略的评估与可视化,我们将使用 Quantstats 来实现。
Tip
使用知名的第三方框架来进行策略评估的好处不仅仅是省事,更重要的是便于策略之间进行比较。尽管算法都是公开的,但不同的策略评估框架在对缺失值的处理方式、默认参数的选择上还是存在差异。
我们先介绍如何实现第2步和第3步,即调仓和收益计算。
假设我们已经获取了股票的日线行情数据。由于我们的策略是按月调仓,所以,我们将行情数据重采样成了月线数据。
现在,这份数据看起来如下图所示:
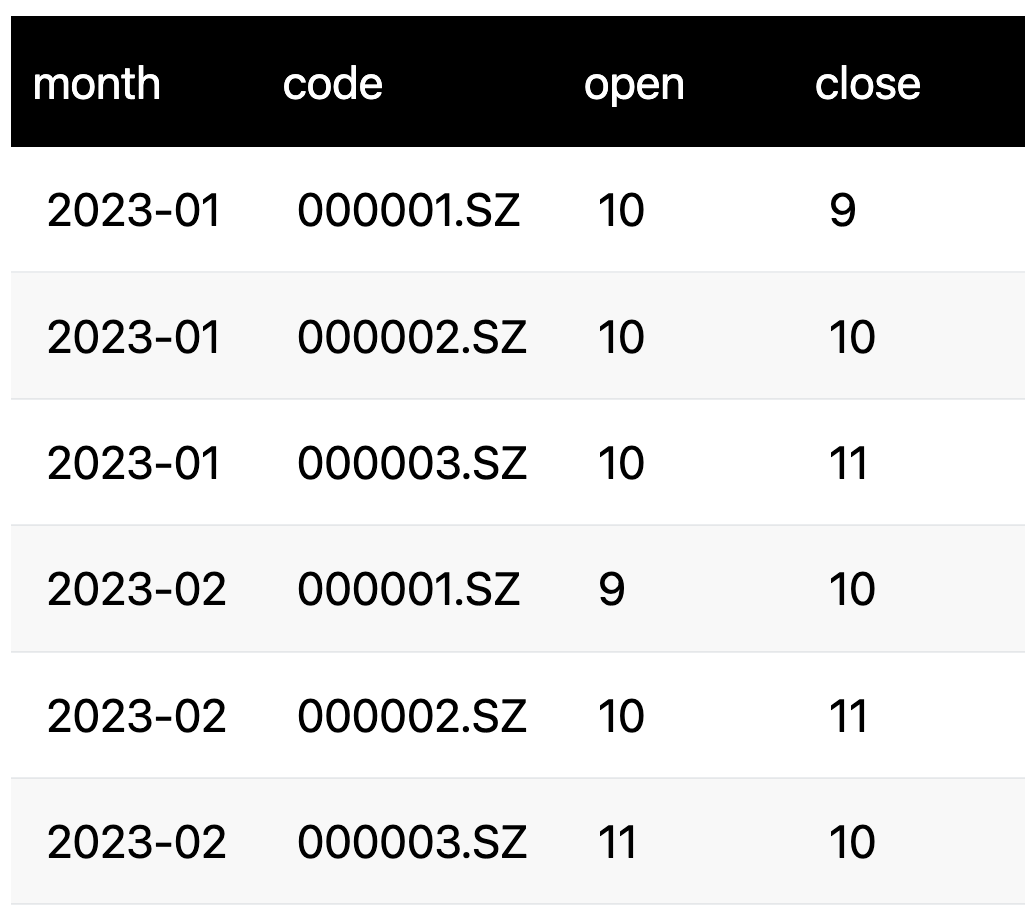 图3 月行情数据
对月度调仓策略,先将数据重采样到月是一个重要的技巧。如果不这样,你就要先确定每个月的调仓日(每个月还不固定),再根据这个调仓日,去查找个股当天的因子数据和收盘价。一旦调仓日有个股停牌,就会出现数据缺失。
另一个好处是,现在我们可以在上月发出调仓信号后,按下月的开盘价买入,下月的收盘价卖出,这样严格地避开了未来数据。一些策略在计算收益时,仅使用收盘价,这样不可避免地要么引入未来数据,或者信号响应不及时。
现在,计算收益就变得很简单。比如,计算基准收益就是:
```{code-block} python
df.groupby("month").apply(lambda x: (x.close / x.open - 1).mean())
 1
 2
 3
 4
 5
 6
 7
 8
 9
10
11
12
13
14
15
16
17
18
19
20
21
22
23
24
25
26 | <div style='width:50%;text-align:center;margin: 0 auto 1rem'>
<img src='https://cdn.jsdelivr.net/gh/zillionare/imgbed2@main/images/2025/08/20250806133629.png'>
<span style='font-size:0.8em;display:inline-block;width:100%;text-align:center;color:grey'>图4 基准收益计算</span>
</div>
如果要计算组合的收益率呢?我们需要增加一列,先标记出哪些股票在当月的股票池中:
<div style='width:50%;text-align:center;margin: 0 auto 1rem'>
<img src='https://cdn.jsdelivr.net/gh/zillionare/imgbed2@main/images/2025/08/20250806135848.png'>
<span style='font-size:0.8em;display:inline-block;width:100%;text-align:center;color:grey'>图5 组合收益计算</span>
</div>
在图5中,我们增加了3列。其中 filter_1 是用来筛选股票的基础数据,比如,研报要求按每月筛选出股息率前 500 的股票,这一列就可以是股息率数据。
flag 列是根据 filter_1 列的数据,按照规则生成的『个股是否在股票池』的标记。在图中,假定规则是,如果 filter_1 大于零,则该个股在下个月的股票池中。这样我们就得到了2023年2月的股票池。
现在,我们计算策略收益时,只需要按月执行:
$$
\frac{\sum(returns \times flag)}{\sum flag}
$$
就能得到每月的策略收益。这一步相当于执行代码:
```{code-block} python
df.groupby("month").apply(lambda group: group[group["flag"] == 1]["returns"].mean())
|
到这一步为止,我们已经明确了要实现一个极简的月度回测框架,大致上要做的事情如下:
- 获取行情数据,重采样成为月度数据
- 根据策略要求,获取相关数据,构建因子
- 将第2步中构建的因子 (factor) 也重采样成为月度数据,附加到1中生成的 DataFrame 中
- 根据策略逻辑,将 factor 列转换成为 flag 列。
- 按月计算基准收益和策略收益
- 调用 quantstats 生成回测报告。
Moonshot 的实现
我们把这个极简框架命名为 Moonshot,因为它更适合固定按月调仓换股的策略。它的核心是一个名为 Moonshot 的类:
  1
  2
  3
  4
  5
  6
  7
  8
  9
 10
 11
 12
 13
 14
 15
 16
 17
 18
 19
 20
 21
 22
 23
 24
 25
 26
 27
 28
 29
 30
 31
 32
 33
 34
 35
 36
 37
 38
 39
 40
 41
 42
 43
 44
 45
 46
 47
 48
 49
 50
 51
 52
 53
 54
 55
 56
 57
 58
 59
 60
 61
 62
 63
 64
 65
 66
 67
 68
 69
 70
 71
 72
 73
 74
 75
 76
 77
 78
 79
 80
 81
 82
 83
 84
 85
 86
 87
 88
 89
 90
 91
 92
 93
 94
 95
 96
 97
 98
 99
100
101
102
103
104
105
106
107
108
109
110 | class Moonshot:
def __init__(self, daily_bars: pd.DataFrame):
self.data: pd.DataFrame = resample_to_month(
daily_bars, open="first", close="last"
)
self.data["flag"] = 1
self.strategy_returns: pd.Series | None = None
self.benchmark_returns: pd.Series | None = None
self.analyzer: StrategyAnalyzer | None = None
def append_factor(
self, data: pd.DataFrame, factor_col: str, resample_method: str | None = None
) -> None:
"""将因子数据添加到回测数据(即self.data)中。
如果resample_method参数不为None, 则需要重采样为月频,并且使用resample_method指定的方法。
否则,认为因子已经是月频的,将直接添加到回测数据中。
使用本方法,一次只能添加一个因子。
Args:
data: 因子数据,需包含'date'和'asset'列
factor_col: 因子列名
resample_method: 如果需要对因子重采样,此列为重采样方法。
"""
if resample_method is not None:
factor_data = resample_to_month(data, **{factor_col: resample_method})
else:
data_copy = data.copy()
# 确保date列是datetime类型
if not pd.api.types.is_datetime64_any_dtype(data_copy["date"]):
data_copy["date"] = pd.to_datetime(data_copy["date"])
data_copy["month"] = data_copy["date"].dt.to_period("M")
# 检查是否有重复的(month, asset)组合
duplicates = data_copy.duplicated(subset=["month", "asset"])
if duplicates.any():
duplicate_count = duplicates.sum()
raise ValueError(
f"发现 {duplicate_count} 个重复的(month, asset)组合。"
"当resample_method=None时,传入的数据必须是无重复的月度数据。"
"如果您的数据是日频或有重复记录,请指定resample_method参数,"
"如:resample_method='last'、'mean'、'first'等"
)
factor_data = data_copy.set_index(["month", "asset"])[[factor_col]]
self.data = self.data.join(factor_data, how="left")
def screen(self, screen_method, **kwargs) -> "Moonshot":
"""应用股票筛选器
Args:
screen_method: 筛选方法(可调用对象)
**kwargs: 筛选器参数
Returns:
Moonshot: 返回自身以支持链式调用
"""
if callable(screen_method):
flags = screen_method(**kwargs)
# 当月选股,下月开仓
flags = flags.groupby(level="asset").shift(1).fillna(0).astype(int)
# 与现有flag进行逻辑与运算
self.data["flag"] = self.data["flag"] & flags
return self
def calculate_returns(self) -> "Moonshot":
"""计算策略收益率和基准收益率(向量化实现)
使用向量化操作计算:
1. 策略收益:每月flag=1的股票的等权平均收益
2. 基准收益:每月所有股票的等权平均收益
"""
# 计算所有股票的月收益率 (close - open) / open
self.data["monthly_return"] = (self.data["close"] - self.data["open"]) / self.data[
"open"
]
# 按月分组计算策略收益(flag=1的股票等权平均)
def calculate_strategy_return(group):
selected = group[group.get("flag", 0) == 1]
if len(selected) > 0:
return selected["monthly_return"].mean()
else:
return 0.0
strategy_returns = self.data.groupby("month").apply(calculate_strategy_return)
strategy_returns.name = "strategy_returns"
# 向量化计算基准收益(所有股票等权平均)
benchmark_returns = self.data.groupby("month")["monthly_return"].mean()
benchmark_returns.name = "benchmark_returns"
# 存储结果
self.strategy_returns = strategy_returns
self.benchmark_returns = benchmark_returns
self.analyzer = StrategyAnalyzer(
strategy_returns=self.strategy_returns, benchmark_returns=self.benchmark_returns
)
return self
|
Moonshot 的使用方法如下:
```{code-block}python
daily_bars = ...
ms = Moonshot(daily_bars)
构建因子并加入到模型中
ms.append_factor(...)
回测
ms.screen(screen_func, **kwargs).calculate_returns().report()
 1
 2
 3
 4
 5
 6
 7
 8
 9
10
11
12
13
14 | Moonshot 在初始化时,就要求我们传入日线行情数据,以便它可以构建最基础的数据结构(图3)。然后,我们可以通过 append_factor将因子加入模型中。
接下来,我们需要定义转换函数 screen_func,用来实现通过因子按月筛选股票,即实现图5中所示的转换。
我们把 screen 方法定义为链式调用,这样如果一个策略存在多个筛选条件,使用者只需要定义好各种筛选条件(screen_func),再依次调用 screen 方法即可。
最后,screen 方法返回 Moonshot 实例,我们可以在此基础上调用计算收益和输出报告等方法。
在 Moonshot 中,我们还调用了一个名为 resample_to_month 的方法,这个方法将时间序列数据重新采样到月度级别。
在 pandas 中,已经提供了 resample 方法:
```{code-block} python
df.groupby("asset").resample("ME").agg({"open": "first", "close": "last"})
|
但是,在数据量较大时(比如50万条记录左右),这个方法就比较慢,在一次运行中,我大约等待了10多秒。原因是 pandas 的聚合操作一直是它的性能短板,这也是像 polars 或者 duckdb 的优势所在。
在这里,我们给出一个 polars 的实现:
 1
 2
 3
 4
 5
 6
 7
 8
 9
10
11
12
13
14
15
16
17
18
19
20
21
22
23
24
25
26
27
28
29
30
31
32
33
34
35
36
37
38
39
40
41
42
43
44
45
46
47
48
49
50
51
52
53
54
55
56
57
58
59
60
61
62
63
64
65
66 | def resample_to_month(data: pd.DataFrame, **kwargs) -> pd.DataFrame:
"""按月重采样,支持多列同时重采样
Example:
>>> resample_to_month(data, close='last', high='max', low='min', open='first', volume='sum')
参数:
data: DataFrame,需包含'date'和'asset'列。数据不要求有序。
**kwargs: 关键字参数,格式为"列名=聚合方式"
支持的聚合方式:'first'(首个值)、'last'(最后一个值)、
'mean'(平均值)、'max'(最大值)、'min'(最小值)
返回:
重采样后的DataFrame
"""
df = pl.from_pandas(data)
df = df.with_columns(pl.col("date").cast(pl.Datetime))
df = df.with_columns(
pl.concat_str(
[
pl.col("date").dt.year().cast(pl.Utf8),
pl.lit("-"),
pl.col("date").dt.month().cast(pl.Utf8).str.pad_start(2, fill_char="0"),
]
).alias("month")
)
# 定义支持的聚合方式映射(列名 -> 聚合表达式)
agg_methods = {
"first": lambda col: col.sort_by(pl.col("date")).first(),
"last": lambda col: col.sort_by(pl.col("date")).last(),
"mean": lambda col: col.mean(),
"max": lambda col: col.max(),
"min": lambda col: col.min(),
"sum": lambda col: col.sum(),
}
# 构建聚合表达式列表
agg_exprs = []
for col_name, method in kwargs.items():
if col_name not in df.columns:
raise ValueError(f"数据中不存在列: {col_name}")
# 检查聚合方式是否支持
if method not in agg_methods:
raise ValueError(
f"不支持的聚合方式: {method},支持的方式为: {list(agg_methods.keys())}"
)
# 添加聚合表达式
agg_exprs.append(agg_methods[method](pl.col(col_name)).alias(col_name))
if not agg_exprs:
raise ValueError("至少需要指定一个列的聚合方式(如open='first')")
result = (
df.group_by(pl.col("asset"), pl.col("month"))
.agg(agg_exprs)
.sort(pl.col("month"), pl.col("asset"))
)
result = result.to_pandas()
result["month"] = pd.PeriodIndex(result["month"], freq="M")
return result.set_index(["month", "asset"])
|
这个函数接受 dataframe 作为输入,最后也返回一个 dataframe,只在中间过程中使用polars。额外的数据格式转换会有可以忽略的性能损失,但是,坚持使用 dataframe 作为各个模块、各个方法之间的数据传递格式,会大大降低 coding 的难度。
现在,我们使用真实的数据,构造一个 Moonshot 对象,看看 resample_to_month() 函数的运行结果如何。
| start = datetime.date(2018, 1, 1)
end = datetime.date(2023, 12, 31)
barss = load_bars(start, end, 100)
ms = Moonshot(barss.reset_index())
ms.data
|
现在我们看到,数据确实被重采样成了月度数据,并且索引是已经被设置为月度时间戳。
这一期内容就到这里。下一期我们将实现研报中的第一个筛选器 -- 股息率。我们将完整地实现获取数据、定义筛选器方法,并且进行一个完整的回测。